Process Analysis — Additional Techniques

In a previous article, "Overview of Analysis Techniques," the Top Five analysis techniques were covered with a promise to provide an overview of additional techniques used by process analysts. This article will cover some of the other analysis techniques and outline a variety of typical problems found in business processes, aligning those to the techniques introduced here. It will also briefly discuss which process modeling techniques are the most useful, depending on the type of problem and type of analysis being used.
There are a multitude of techniques that can be used to analyze processes. This is part of the problem — too many choices. In the previous article, five critical techniques were discussed, and a brief overview of each was provided. Those techniques were:
- Gap Analysis
- Value Add Analysis
- Root Cause Analysis
- Observation
- Examining the Experience
In most cases, the majority of critical issues will be identified using the above techniques. However, there are always subtle concerns that follow the Pareto principle, which loosely states that 80% of the problems are in 20% of the processes. There are multiple techniques available to analyze processes further. Some of them can and should be used in conjunction with the visual version of the process — the process model — while others utilize a combination of information gathered about the process and the measurements associated with the process. This article provides an overview of those techniques used in conjunction with a process model. A subsequent article will provide an overview of those techniques that do not require access to a process model.
Common Process Problems
The work of a process analyst is not always easy. There are many obscure and subjective issues faced by organizations. It is the challenge of the process analyst to discover the cause of these issues and to develop recommendations for solutions.
Although some process problems and inefficiencies are directly related to a specific industry or to the type of process, many of the opportunities to improve processes are common to 80-90% of the activities in the existing processes, regardless of industry or specific process.
Table 1 provides suggestions for modeling and analysis techniques that may prove useful when addressing some of the problems common to businesses. This is not an exhaustive list of problems, but hopefully this list will get you started and help generate ideas for other appropriate questions to ask.
|
Common Business Problems |
Potential Modeling Techniques |
Analysis Techniques |
|
Data redundancy is common. |
High Level IGOE |
Sequence /Flow Analysis |
|
Management frequently throws people and or money at the problem, but it doesn't improve. |
IGOE Flow Model |
Exception Matrix |
|
Work is often expedited, to meet customer expectations. |
IGOE Flow Model |
Critical Path Analysis |
|
Data integrity is a constant problem. |
High Level IGOE |
Sequence /Flow Analysis |
|
There a high level of frustration among the employees. |
IGOE Flow Model |
RACI Analysis |
|
Activities in the process span several departments, and there is finger-pointing and blaming. |
Swimlane Model |
RACI Analysis |
|
No one knows or manages the total process. |
Swimlane Model |
RACI Analysis |
|
Everyone spends a great deal of time 'fire fighting'. |
IGOE Flow Model |
Scenario Analysis |
|
Getting the work done just takes too long. |
IGOE Flow Model |
Critical Path Analysis |
|
The process was never purposefully planned and has consistently produced errors, rework, mistakes, or scrap in excess. |
Node Tree |
Sequence /Flow Analysis Role Playing |
|
Complexity, exceptions, and special cases are common but not strategically directed. |
High Level IGOE |
Scenario Analysis |
|
Processes/activities aren't measured or controlled. |
Swimlane Model |
Sequence /Flow Analysis |
|
Inventory, buffers, and other assets sit idle. |
High Level IGOE |
Critical Path Analysis |
|
Too many reviews and approvals. |
State Change Model |
State Change Analysis |
Table 1. Model & Analysis Techniques to Address Business Problems.
Principles of Process Analysis using a Process Model
For many of the techniques used to analyze process, the use of the documented process — the process model — will be a useful tool. However, in many organizations the process model may represent a very detailed view of the process and can therefore act as a type of distraction if the analyst isn't disciplined about how to leverage the model to assist with the analysis.
In a perfect world, the process model would represent how the work gets done, starting from the Architecture Level and then decomposing or breaking the process down into more detail until the model indicates specifically how the work gets done by the various roles involved. This could be at a level three or four, depending on the complexity of the process and level at which the process model started.
The normal decomposition starts at the Architecture level or Conceptual level and is then decomposed to a sub-process, or perhaps activity level if it's not an extremely complex process. From the activity level, the process is then decomposed to the task and then step level. When examining the as-is process, it is recommended that the analyst initially stop decomposing the process when the activity level is reached. The activity level model is an excellent starting point for any of the analysis techniques.

Figure 1.
Architecture View of an Organization's Processes


Figure 2.
Node Tree Decomposition of Process
Various Analysis Techniques
The list below encompasses most of the remaining types of analysis that can be applied to an organization's business processes in an effort to determine what and where the most productive changes can be make. These analysis techniques can be done in conjunction with a process model.
- Critical Path Analysis
- Sequence / Flow Analysis
- Feedback Loops
- Role and Responsibility Analysis (RACI)
- Comparisons to Documented Procedures
- Role Playing
- Scenario Analysis
- State Change Analysis
There are other techniques that do not require a process model but only an accurate understanding of the as-is process. These will be covered in a subsequent article. They include:
- Process Constraint Analysis
- Customer Requirements Analysis / Kano Analysis
- Matrices Analysis
- Correlation Matrix
- Exception / Variation Matrix
- Process / Activity to Objectives, People, Issues, Projects, Organization, Technology, Information, Policies / Procedures / Rules / etc.
- N x N Matrices
- Pareto Analysis
- Force Field Analysis
- Scatter Chart
- Cultural Factor Analysis
- Customer Focus Groups
- Supplier Feedback
Recommended Model Analysis Steps
When utilizing the process model as one of the tools for analyzing processes, the following steps should be followed:
- Prioritize the focus of the model analysis.
- Simplify the model view.
- Determine if more detail is required.
- Create a task flow, if necessary for understanding.
Examine the process at the next level, and reevaluate the previous priorities. Adjust priorities for overall process, if necessary. Stay focused, being aware of 'analysis paralysis'. It is important to timebox the analysis phase and Stop when time is up!
Here is a more detailed look at each of the steps.
1. Prioritize the focus of the model analysis.
- Start with Goals, Objectives, and CSFs (Critical Success Factors).
- Consider time allocated to analysis in the project plan.
- Gather input from other analysts and the 'people in the process'.
- Indicators such as color or letters (e.g., A, B, C) can be used to indicate priority.

Figure 3.
Process Flow of Activity Level
2. Simplify the model view.
- Examine the simplified view for inefficiencies in the flow or overriding constraints.
- Validate all triggering events and dependencies.
- Examine the flow for critical path, looking for sequencing that could be improved with parallel processing.
- Look for false dependencies, constraining events in the process that have been imposed by tradition or policy.

Figure 4.
IGOE Flow Model
3. Determine if more detail is required.
Use the following criteria to determine if more detail is required:
- The activity directly touches the external customer.
- The activity is the 'first' initial contact with customer.
- The activity is complex and not well understood.
- The same activity occurs in multiple situations.
- There is a lack of agreement as to what really happens in the activity.
- There is a lot of variation as to how the activity is conducted.
- There are apparent problems, dissatisfaction, or breakdowns with the activity.
- Work in the activity will still be required after redesign.
- This saves time in the redesign phase since the to-be model will be more detailed for implementation.
- If a review of measurement information indicates:
- Activities with high resource utilization or costs;
- Activities with bottlenecks, delays, queues, or inventories;
- Activities with enabler shortages;
- Activities with apparent over or under control;
- Activities with high error rates;
- Activities with high resource turnover.
4. Create a task flow, if necessary for understanding.
At each level of decomposition examine the flow for:
- Disconnects
- Redundancies
- Feedback loops
- Control points

Figure 5.
Task Decomposition Node Tree & Task Flow
Analysis Techniques in Conjunction with a Process Model
Critical Path Analysis
The core concept of Critical Path Analysis is that some activities are dependent on other activities being completed first. Assumptions are often made about the order and sequence of activities in a flow, many times based on tradition and culture. Assumptions related to dependencies require a level of objectivity that is difficult to obtain through more traditional means such as Swimlane Diagrams. However, when the process flow is represented with an IGOE Flow Model, the lack of real dependencies is immediately obvious.

Figure 6.
IGOE Flow Model
Consider the IGOE Flow Model shown in Figure 6. In this visual representation of the process flow, the first noticeable distinction is the fact that most of the activities are not actually connected through the input/output flow. This is an indication that information is not being updated in these activities but simply being referenced to guide the actions in the activities.
The flow is disrupted and disjointed, which should prompt questions about more efficient and effective ways to do this work. It should also raise questions regarding the order of the activities and whether using the information only as reference is a valid use of the information.
More traditional views of critical path are a PERT chart and a GHANT chart, as shown in Figures 7 and 8 (respectively). These examples represent the more traditional, 'project' type of information commonly related to the idea of critical path. It is very common to apply this kind of analysis to a project plan but is less often considered when conducting process analysis. The result is that many issues surrounding the order in which work is done and the path that information follows are often missed as part of the analysis of the as-is process.

Figure 7. Critical Path Analysis - PERT Chart
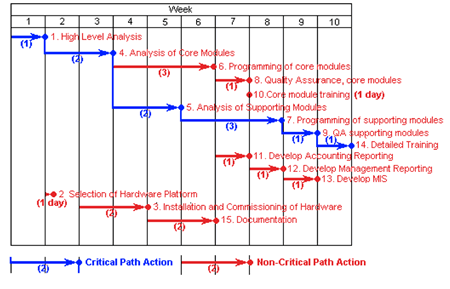
Figure 8.
Critical Path Analysis - GHANT Chart
Whatever method an analyst applies to a process, it is important to utilize the visual method that is most understandable by the audience if the model will be used to explain the results of the analysis. All too often the models used by the analyst to assist with the analysis of the process are not used as part of a presentation.
Sequence / Flow Analysis
Some of the easiest problems to miss in a process involve the sequence or flow of information. This is probably because it's easy to get caught up in the tradition of "we've always done it that way" or "if it isn't broken, don't fix it." Consideration should be given to the idea that just because something worked well and was quite successful 5 years ago (or even 2-3 years ago) that doesn't mean that as things change and the business changes the way the work is done shouldn't also be examined to determine if it should change as well.
To discover these opportunities it may require the input from someone who is not part of the process on a daily basis, perhaps even someone who is new to the organization and doesn't already understand "how things are done." A process flow model is extremely helpful in these situations. However, the method used to depict that flow will influence the analyst's ability to see the problems. A traditional Swimlane Diagram may represent the process in a view that makes everything look ok. An IGOE flow model will show only where transformation is occurring, thus making it easier to see where there are opportunities to re-sequence activities in order to obtain a faster cycle time, increase data integrity, and obtain a more efficient use of resources. (Refer to the IGOE Flow Model in Figure 6.)
Part of sequence analysis is the concept of CRUD analysis. The CRUD acronym is translated as:
- C (Create) — Where is information/data created?
- R (Reference) — Where, when, by whom, or what information/data is referenced or used as a type of guidance information? This could be something as simple as looking up information in a table to fill in a field on a screen, or it could reference a more complex usage such as information for decision-making purposes or strategic decisions.
- U (Update) — Where is information/data updated, transformed, or changed in some way to distinguish it from its original format or intent?
- D (Deleted) — Where, when, or by whom is information/data deleted or removed from usage? This could also reference when information or data is archived for legal retention or storage purposes.
The correct sequencing of these four actions is very important. Understanding the relationships and dependencies between the various pieces of information or data determines when, where, and who has access to information/data and whether its integrity can be trusted.
Many analysts may not realize that the process model itself can provide that information if it has been created as an IGOE model. The IGOE Flow Model clearly indicates where information is created, what information is used as reference-only information, and what information is referenced as well as updated. It also shows where information is archived or deleted, as well as when and by whom information is updated, and what rules drive those updates.
Feedback Loops
Feedback loops occur when the flow of information in a process moves back 'upstream'. For example, say that a metric is collected in an activity to be used to evaluate and monitor the process. The metric is sent back 'upstream' in the process to be used as a guide for changes and adjustments to earlier activities. Or, an individual requests a loan but fails the initial credit check. The loan may be sent back to an earlier activity to gather more information from the customer. The area within the circle in Figure 9 represents a feedback loop in this flow.

Figure 9.
Task-Level Process Flow
Feedback Loops can be generally classified into two categories:
- Good
- Output to Guide: Look for in as-is — design into to-be.
- Bad
- Output to Input: Examine closely as a potential opportunity to improve.
These are either considered to be control points in the process, part of the knowledge sharing/lessons learned process, or part of the continuous improvement, monitoring, and measuring process.
This type of flow is almost always representative of rework or redundancy. Rarely are there any value-add reasons to re-process a transaction. These should be examined closely as candidates for elimination.

Figure 10.
Feedback Loop Example
Role and Responsibility Analysis (RACI)
Numerous inefficiencies and waste can occur in process as a result of how information flows from one role to another, how long it stays with a role, how often the information comes back to that role for reviews, validation, or updates, and whether the role performs work on the information or is simply a 'mailbox' through which information flows with no value-add. In organizations today there is a disconcertingly large number of such 'mailbox' roles.
This is so obviously a non-value-add concept it prompts the question "why do people work this way?" The honest answer often is "because we've always done it this way" or "in the past it was necessary to review and validate the information, but due to changes in the business environment this is no longer necessary — we just haven't gotten around to changing it."
One of the best ways to analyze roles in a process is to create a Swimlane Diagram or to reference an existing one. Swimlane Diagrams were initially created to examine the 'white space' in an organization, meaning to look at all the handoffs from one functional area of an organization to another and to analyze whether those handoffs add any value to the process.

Figure 11.
Swimlane Diagram
When we look at a Swimlane Diagram, it can represent handoffs between activities in a process from numerous perspectives. Those might be:
- Organizational / Functional
- Job-related
- Role-related
When using a Swimlane Diagram for purposes of analysis, the activities listed below will be helpful in identifying opportunities to improve the process.
- Start with the premise of "touch it once; do it right."
- Look for Roles participating multiple times.
- Question the number of Roles involved.
- Hand offs should be reduced to a minimum.
- Examine the sequence of the activities.
- Question any built-in dependencies for validity.
Comparisons to Documented Procedures
Since many of the 'ways of working' in an organization originate from policies, procedures, and tradition, it will often be beneficial to compare the as-is process model to the actual procedures. This will assist with the determination of whether the model is accurate and will also assist with change management.
Role Playing
Role Playing can be a very effective analysis and validation technique. When documenting and understanding the as-is situation, one common dilemma faced by analysts is whether the documented process represents what actually happens or is a should-be situation (or combination of as-is and should-be). Role Playing is one technique for discovering the truth.
In Role Playing, individuals are assigned roles within the process that are different from their normal role. This is an attempt to encourage them to question, "is this how it's really done?" Role Playing can be done as an enactment of the process that might be recorded as a video for review, or you can gather representatives from the process in a room and assign each person a role.
Transactions moving between roles can be represented by a unique method that distinguishes physical/manual transactions from electronic transactions. For example, manual transactions could be represented with blue cards and automated transactions represented by green cards. Participants are then asked to pay particular attention to the number of times they see the same transaction and how many different roles they hand transactions to during the course of the reenactment.
Scenario Analysis
Scenarios are a form of story telling or role playing but in a more structured way. Typically, a table or matrix is created that represents the 'major' conditions or decisions points in the process flow. This must be carefully controlled or the table will become so large it's no longer feasible to use. The number of conditions should be kept between 3-7.
A table or matrix is then created for each type of triggering event if there are multiple events and for each type of major stakeholder, particularly external stakeholders. It is not necessary to create different tables or matrices for the different stakeholders if their expectations are exactly the same. (However, this is rarely the case.)
Metrics are then gathered relating to the likelihood of each scenario's occurence. This helps focus the analyst on those scenarios that are most likely to occur. These should be analyzed first for opportunities for improvement.
Another name for scenarios is use case. Normally, a use case will conceptually represent the same information as a scenario but will be in a different format. Usually most use cases are initially created using a visualization language called UML. These diagrams are then supported with detailed spreadsheets and used to help create test cases when systems are available to support the process.

Figure 12.
Scenario Analysis
State Change Analysis
When analyzing a process that is focused on transactional information or data, a state change model may be extremely useful for understanding all the states a transaction goes through, who touches it, how long it takes, how often it fails, and how many roles are involved. There are a variety of methods that can be used to create a state change model. Figure 13 is just one example.
When analyzing a state change model the analyst should ask, at a minimum, the following questions:
- Why each must occur — are they absolutely necessary?
- Are they in the most efficient order?
- What are the metrics associated with the transactions?
- For example:
- How many go through the process successfully?
- How many are rejected outright?
- How many are rejected and corrected?
- How many are cancelled?
- How long does each transaction spend in each state?

Figure 13.
State Change Model
Summary
Considering all the various techniques available for analyzing a process, it's easy to understand how analysts can become distracted during the analysis phase of a process project and miss identifying the real problems. Remember, the analysis phase has the potential to provide the highest ROI of all the phases and that includes the to-be or redesign phase because if the real problems are not identified then the to-be work may unintentionally design the same problems back into the processes.
This article started out as a summary to provide an overview of a variety of techniques and methods, and somehow it became longer than intended. I hope it provides some useful information for analysts who may be struggling a bit with the analysis phase or analysts who are looking for a different method or technique that may help them with a particular problem they're trying to solve.
The next article will cover additional analysis techniques that can be conducted without the use of or access to a process model. However, all analysis techniques require an understanding of the process. I will also be writing a future article to clarify how all these various techniques fit into Lean, Six Sigma, and various Continuous Improvement methods.
Until next time, do your best to "Keep It Simple." Complexity normally returns one result, "Confusion."
# # #
Standard citation for this article:
About our Contributor:

")


Online Interactive Training Series
In response to a great many requests, Business Rule Solutions now offers at-a-distance learning options. No travel, no backlogs, no hassles. Same great instructors, but with schedules, content and pricing designed to meet the special needs of busy professionals.
How to Define Business Terms in Plain English: A Primer
How to Use DecisionSpeak™ and Question Charts (Q-Charts™)
Decision Tables - A Primer: How to Use TableSpeak™
Tabulation of Lists in RuleSpeak®: A Primer - Using "The Following" Clause
Business Agility Manifesto
Business Rules Manifesto
Business Motivation Model
Decision Vocabulary
[Download]
[Download]
Semantics of Business Vocabulary and Business Rules