Applying Euler Diagrams and Venn Diagrams to Concept Modeling

Abstract:
This article introduces Euler diagrams and Venn diagrams as business analysis instruments. Application of these visual schematics to support development of vocabulary and concept models can help business analysts deal with the complexity of relationships between concepts. It also can help contributing subject matter experts overcome a perplexity commonly observed with intricate aspects of concept modeling. Visualizing typical relationships between concepts with circles that include, exclude, and intersect each other results in simple visual schematics that assist in conducting concept analysis and modeling activities. An implementation example is provided, based on a vocabulary development in the public health domain of immunization information systems.
DISCLAIMER: The findings and conclusions in this article are those of the author and do not necessarily represent the official position of the Centers for Disease Control and Prevention.
Introduction
Euler diagrams [1] and Venn diagrams [2] show relationships in a visual way that is easy to understand. They are used extensively as visualizing tools in science applications, such as set theory and logical reasoning, as well as in business reports and presentations, education, and other areas. However, recognition and use of these diagrams in business analysis are quite limited. For example, a thorough catalog of modeling techniques by the leading business analysis certification body [3] mentions Venn diagrams only once, in passing, as one of many possible instruments for scope modeling. While all techniques presented in that catalogue are discussed in extensive detail, there is no discussion of a Venn diagram as a business analysis technique. Another recognized handbook of business analysis techniques from a different certification body [4] mentions neither Euler diagrams nor Venn diagrams. This article discusses the use of Euler/Venn diagrams [a] for concept modeling to illustrate complex relationships between concepts (vocabulary terms and their definitions). We also share our experience with implementing such an approach during development of a public health vocabulary for immunization information systems, as well as propose that such an approach can be employed for concept modeling and other business analysis applications in other settings and industries.
What are Euler/Venn diagrams?
Euler diagrams have been used for centuries as a tool to support logical analysis and reasoning. They were formally described in 1768 by Leonhard Euler [1]. Euler diagrams illustrate relationships between different sets, categories, propositions, and concepts. They are constructed with circles that include, exclude, and intersect each other (Fig. 1–Fig. 3). In 1880, John Venn advanced the concept of Euler diagrams by proposing to display every possible relation between sets, regardless of whether a relation exists [2]. As opposed to a conventional Euler diagram, which consists of circles that either include, exclude, or intersect each other, a Venn diagram always includes intersecting circles [b]. Hence, Venn diagrams may be viewed as a special case of Euler diagram. All Venn diagrams that do not have empty regions of intersecting circles are also considered to be Euler diagrams (Fig. 3). In Venn diagrams, empty intersections and other regions that do not represent existing relationships are often shaded or simply left blank.
Figure 1 illustrates the difference between Euler and Venn diagrams with a simple example involving two sets of numbers: set A = {1, 3, 5} and set B = {2, 4}. Since these two sets do not have any common numbers, the Euler diagram on the left represents these sets with two circles that do not intersect. The Venn diagram represents the same sets with two intersecting circles, and the area of intersection is left empty.
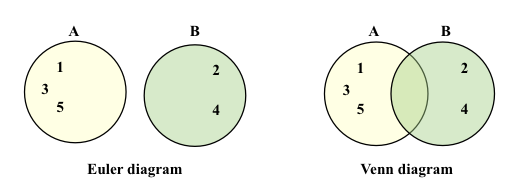
Figure 1. Euler diagram is different from Venn diagram (intersection of A and B is empty).
Figure 2 provides another illustration of the difference between Euler and Venn diagrams based on two sets of numbers: set A = {1, 3, 5} and set B = {1, 3}. The sets have numbers 1 and 3 in common. The Euler diagram on the left visualizes the relationship between these sets with circles that include each other, while the Venn diagram on the right shows, again, intersecting circles with empty region "B that is not A" at the right.
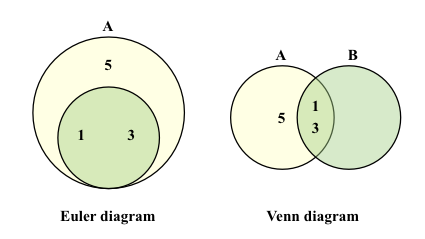
Figure 2. Euler diagram is different from Venn diagram (region "B that is not A" is empty).
Figure 3 illustrates an example that includes three sets of numbers: set A = {1, 2, 4, 7}, set B = {2, 3, 4, 5}, and set C = {1, 2, 3, 6}. Since each of these sets has common numbers with other sets, there are no empty intersections of circles or other regions of circles in this case. Therefore, the Euler diagram here is identical to the Venn diagram.
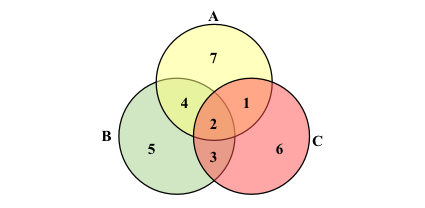
Figure 3. Euler diagram and Venn diagram are identical (no empty intersection regions or other areas).
Euler/Venn diagrams for concept modeling
A concept model, as defined in a seminal book by Ronald Ross [5], is a set of concepts structured according to the relations among them. A concept model includes vocabulary (terms and their definitions), business rules, and diagrams. The main purpose of concept diagrams is to convey a business vocabulary in a visual way that is easily understood by its audience [6].
Concept models are developed by business analysts who distill business knowledge from contributing subject matter experts (SMEs). Arguably, concept modeling is the most complex and challenging activity in business analysis. SMEs are often perplexed when they review concept diagrams that depict intricate classification and categorization relationships between domain concepts. Even after more than 20 years of introducing business analysis methods to a public health community, concept models are considered by public health experts to be the most complex and hard to understand components. Process models, business rules, use cases, event models — all of these are much easier for our audience to understand and work with, but concept diagrams represent a persistent challenge. We observed that challenge across several public health domains (e.g., [7]), as well as across several modeling notations, such as ConceptSpeak [8], Semantics of Business Vocabulary and Business Rules (SBVR) [6], Unified Modeling Language (UML) [9], and others.
Euler/Venn diagrams can help to address that challenge. By their nature and roots in set theory, these diagrams, as augmenting diagrammatic instruments, are perfectly positioned to assist with visualizing relationships for a set of concepts. In this section, we explore the application of Euler/Venn diagrams to various aspects of concept modeling described in Ron Ross's Business Knowledge Blueprints [5]. Examples in Figures 4–12 illustrate some typical aspects of concept modeling, depicted with conventional concept modeling notations [c] [6, 9], as well as with Euler/Venn diagrams.
Figure 4 illustrates a challenge to diagrammatically distinguish with the Euler/Venn diagram between categorization ("a kind of") and whole-part ("includes") concept structures. Indeed, both relationships are based on the notion of inclusion. In the case of the whole-part relationship, it is about "one kind of thing (the whole) that includes other kinds of things (the parts)." In the case of categorization, it is about "conceptual buckets within conceptual buckets—that is, narrower concept within a broader concept." [5] Both of these situations can be depicted with identical Euler diagrams, using two circles that include each other: the larger circle for the whole (or the broader category) and the smaller circle for the part of the whole (or the narrower concept). Conventional modeling notations distinguish between the whole-part and categorization relationships with additional diagrammatic symbols and textual notes. For example, ConceptSpeak [8] uses directional arrows with labels "includes"/"is included in" for the whole-part relationship and bold lines for the categorization. The SBVR modeling notation [6] uses directional arrowheads (without shafts) with the labels "includes," "contains," and "is in" for the whole-part relationship, and lines with empty arrowheads for the categorization relationship. Obviously, Euler/Venn diagrams "out of the box" do not have such established additional diagrammatic symbols and labels for the purposes of concept modeling. Therefore, when Euler/Venn diagrams are used to support concept modeling activities in situations where rigor is important, the addition of clarifying labels to these diagrams is needed.
Another diagrammatic challenge, related to the categorization ("a kind of") relationship, is presented in Figure 5. It is based on an example in which "Health Care Provider" is considered a super-category of the category "Hospital." "Hospital" is considered a kind of "Health Care Provider." The Euler/Venn diagram depicts that in a natural way with intersecting (overlapping) circles. On one hand, since "Health Care Provider" is a broader category compared to the narrower category of "Hospital," a Euler/Venn diagram should use a larger circle for "Health Care Provider" and a smaller circle for "Hospital" (option 1 in Fig. 5). On the other hand, "Hospital" has all the characteristics of "Health Care Provider," plus some additional characteristics that are specific for "Hospital." In that sense, the "Hospital" category is "bigger" than the "Health Care Provider" super-category. Therefore, the Euler/Venn diagram depicts that with a smaller circle for "Health Care Provider" and a larger circle for "Hospital" (option 2 in Fig. 5). In this article, we use Euler/Venn diagrams in a way that is consistent with option 1.
Figures 6–12 depict most typical aspects of concept modeling:
- Classification — instances of a general category (Fig. 6)
- Categorization scheme (Fig. 7)
- Multiple levels of categorization with two levels of categories (Fig. 8)
- Multiple categorizations (Fig. 9)
- Multiple super-categories (Fig. 10)
- Whole-part concept structure (Fig. 11)
- Serialized concept structure (Fig. 12)
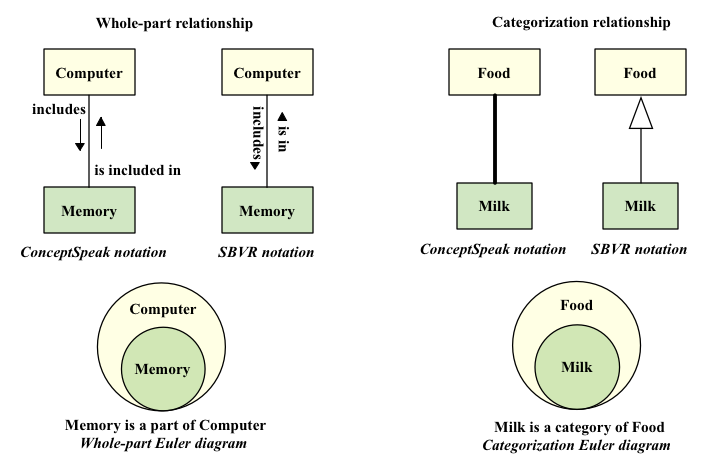
Figure 4. Distinguishing between whole-part ("includes") and categorization ("a kind of") concept structures.
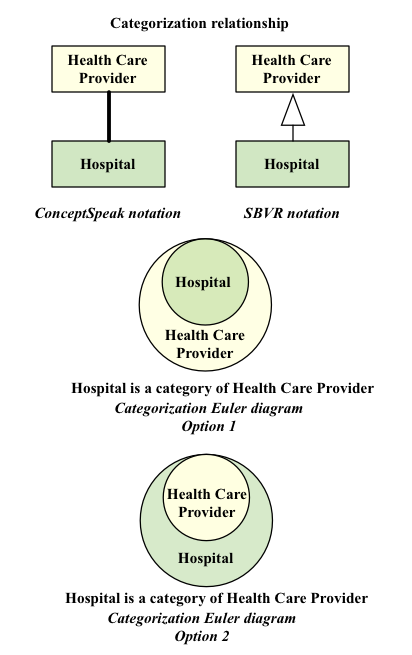
Figure 5. Categorization ("a kind of") relationship: Which circle should be bigger?
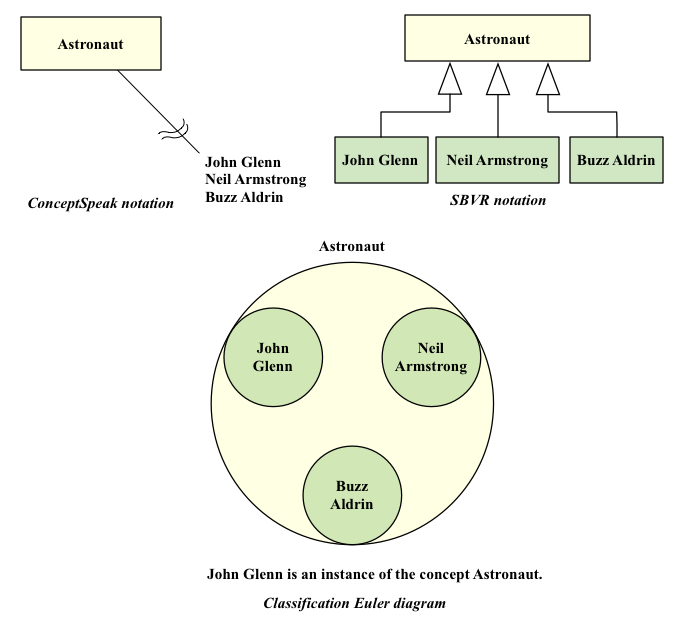
Figure 6. Classification — instances of a general concept 'Astronaut'.
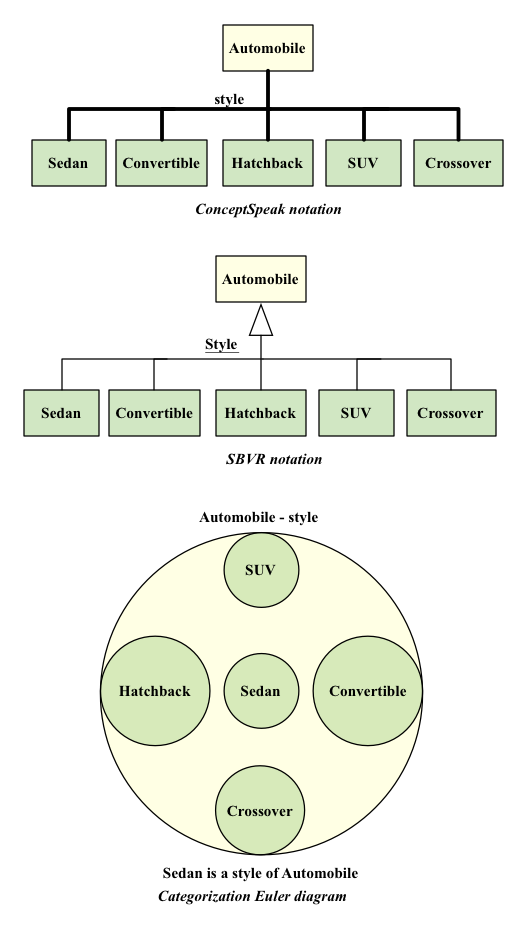
Figure 7. Multiple categories of "Automobile" with a categorization scheme 'style'.
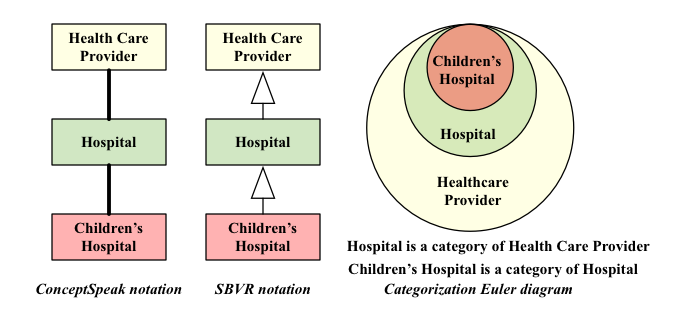
Figure 8. Multiple levels of categorization.
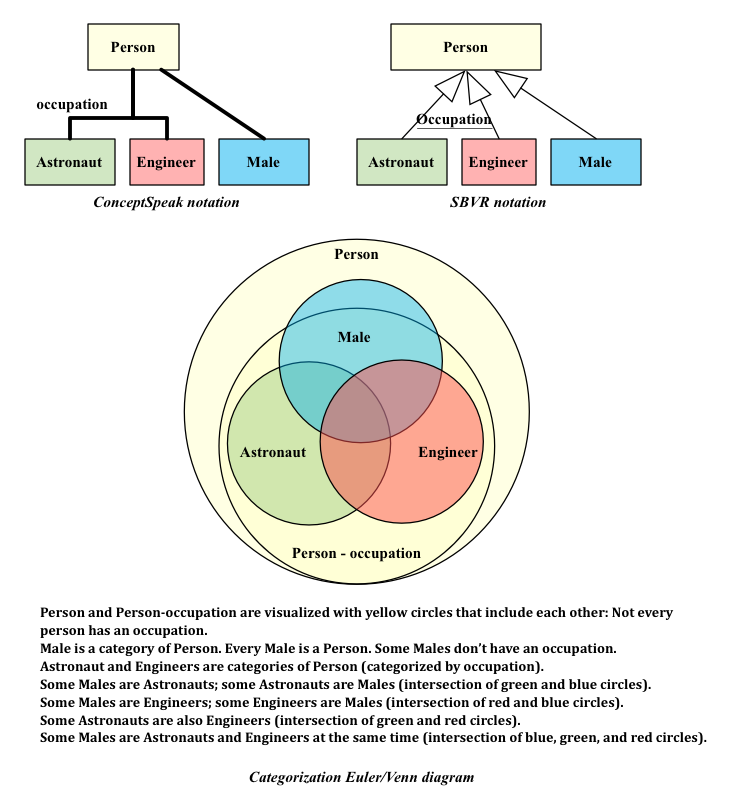
Figure 9. Multiple categorizations for a super-category 'Person'.
Note that the Figure 9 Euler/Venn diagram not only presents information depicted with ConceptSpeak notation, but also visualizes additional information about relationships between categories that is conventionally documented with business rules.
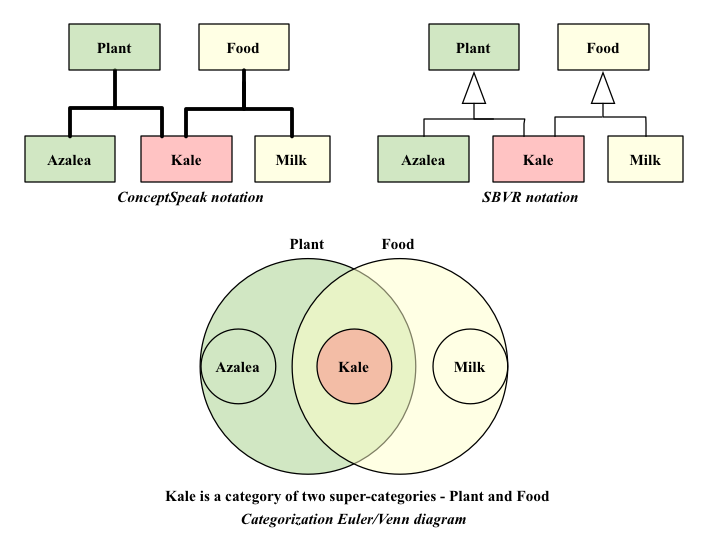
Figure 10. A category of "Kale" with multiple super-categories 'Plant' and 'Food'.
Note that in the Figure 10 Euler/Venn diagram "Kale" is placed in the intersection of circles that represent super-categories "Plant" and "Food," while "Azalea" is located in the region that belongs only to the "Plant" super-category and "Milk" is located in the region that belongs only to the "Food" super-category.
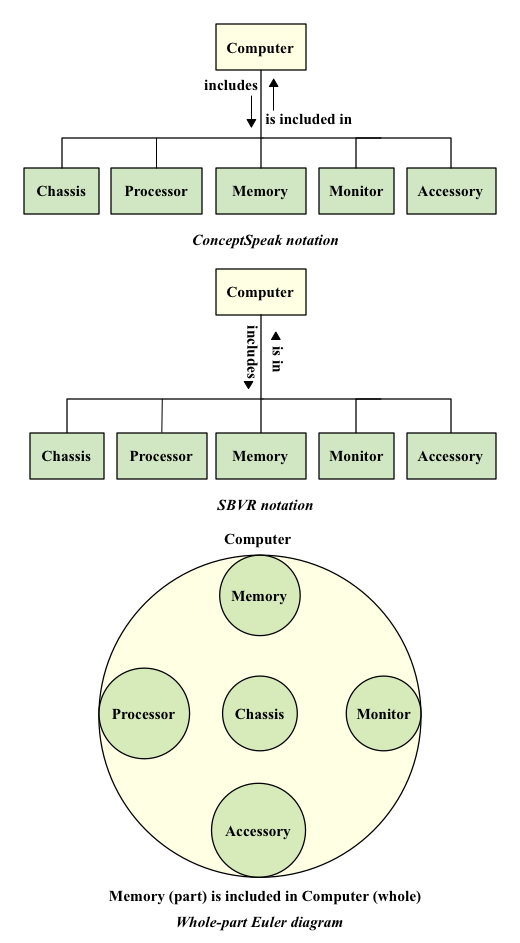
Figure 11. Whole-part concept structure — components of computer.
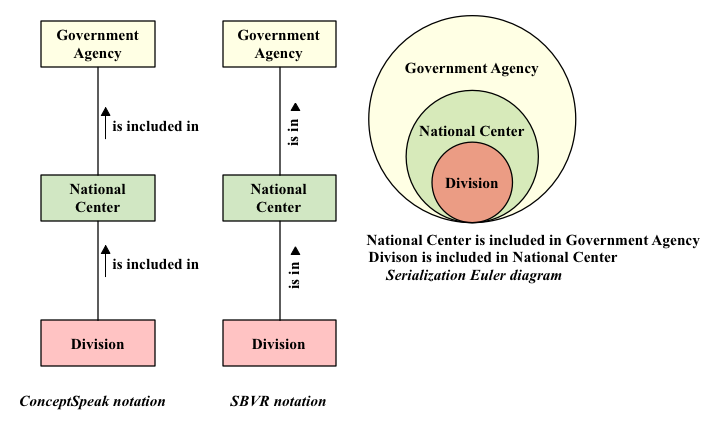
Figure 12. Serialized concept structure — hierarchical organization of a government agency.
Immunization information systems example
As a real-life example, we present a brief case study from 2018, in which Euler/Venn diagrams were used to develop a vocabulary in the public health domain of immunization information systems (IISs) [10–12]. During the concept modeling activities, we faced a common challenge with contributing experts having difficulty with interpreting the multiple categorization concept. The challenge was successfully addressed with implementation of a simple Euler/Venn diagram.
IISs [10] receive and aggregate information about vaccinations that health care providers administer to patients. Various parties then can access [d] that information for immunization coverage analysis, clinical decision support, school vaccination certificates, research, etc. Access to an IIS is based on an explicitly documented authorization. The common vocabulary for IIS operational best practices [11] defines the "IIS-authorized organization" (IIS-AO) as an organization that has an agreement with an IIS that allows for the submittal and/or retrieval of IIS information. Examples of an IIS-AO include a provider organization, vital records office, school, etc. In turn, "provider organization" is defined as an organization that has any combination of the following characteristics: provides vaccination services, is responsible for an entity that provides vaccination services, or manages inventory for an entity that provides vaccination services. A typical example of the provider organization is a health care provider, such as a hospital or county clinic.
Obviously, an IIS deals only with "authorized" provider organizations, i.e., with provider organizations that are IIS-AOs. However, an initial attempt to model the relationship between these two concepts with a direct categorization link ("provider organization is a kind of IIS-AO") has been in vain (see Fig. 13). The participating subject matter experts insisted that the relationship between these two concepts is more convoluted, as there are provider organizations that are not IIS-AOs, as well as IIS-AOs that are not provider organizations. To support that notion, we sketched two Euler/Venn diagrams (Fig. 14): one for a generic example of the concepts "Epidemiologist" and "Female" and another one for the concepts 'Provider Organization' and 'IIS-AO'.
These simplistic Euler/Venn diagrams proved to be very beneficial for facilitating the discussion, helped us to capture the concern, and then to make the next step of introducing the notion of a "parent" entity that has two categorization schemes, depicted with an informal sketch (Fig. 15). This sketch includes two parts: one for a generic multiple categorization example (person–gender of male/female and person–occupation of engineer/epidemiologist/nurse) and another for a task in hand (organization–authorization of IIS-AO/non-IIS-AO and organization–type of provider organization/vital records office/manufacturer). A fragment of the finalized concept diagram is presented in Figure 16.
Euler/Venn diagrams proved to be quite helpful for visualizing a complex relationship between concepts (vocabulary terms) in a manner that is easily understood by nontechnical subject matter experts. That experience has been promising and motivated the author's interest in application of these diagrams to typical concept modeling constructs described in this article, as well as to other areas of business analysis.
Figure 13. Initial capture of the relationship between "IIS-Authorized Organization" and "Provider Organization."

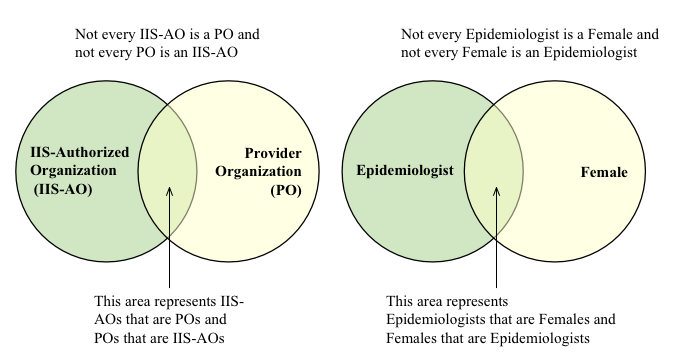
Figure 14. Sketches of the two supporting Euler/Venn diagrams.
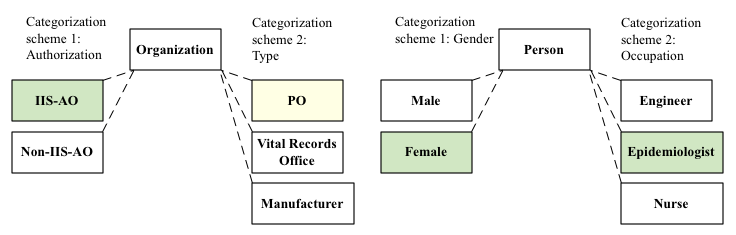
Figure 15. Informal sketch introducing the notion of a "parent" entity ("Organization") that has two categorization schemes.
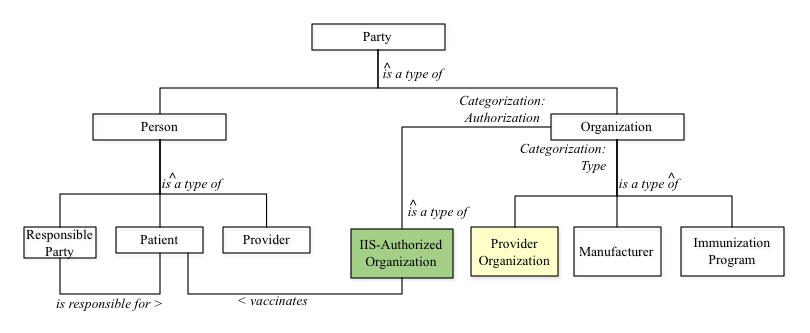
Figure 16. A fragment of the finalized concept diagram.
Conclusion
Euler/Venn diagrams visualize often cumbersome relationships between concepts in an intelligible way that is visually attractive, and, most importantly, appealing and easy to understand for a nontechnical audience. Visualizing concept modeling relationships, such as classification, categorization, whole-part, and others, with circles that include, exclude, and intersect each other is perceived to be more intuitive and easier to interpret for a nontechnical person compared with visualization approaches utilized by conventional modeling notations: hollow-head arrows in SBVR and UML [6,9] and bolded lines in ConceptSpeak [8]. Therefore, Euler/Venn diagrams can serve as a valuable augmenting diagrammatic instrument during concept modeling activities.
Euler/Venn diagrams have an impressive scientific pedigree with a solid basis in the set theory. Hence, application of these diagrams to concept modeling and other analysis activities contributes to the scientific validity of the business analysis discipline. That also provides another reason and opens a possibility for inclusion of Euler/Venn diagrams into standard concept modeling notations [6, 8, 9].
While there is a certain novelty in the approach of applying Euler/Venn diagrams to business analysis, especially to concept modeling, we find it rather surprising that this well-known instrument did not find a widespread application in the business analysis field earlier. We hope this article will serve as a small first step in a journey to a full realization of the potential of Euler/Venn diagrams to benefit and advance concept modeling and other areas of business analysis.
Acknowledgements
The author would like to acknowledge members of the Modeling Immunization Registry Operations Workgroup (MIROW) of the American Immunization Registry Association (AIRA) for challenging questions that stimulated his search for additional analysis instruments to support concept modeling activities.
A special thank you to
- Ronald Ross for providing a comprehensive and systematic overview of concept modeling in his recent book [5] that helped to frame the author's line of thought regarding a promising potential that Euler/Venn diagrams hold in this area of business analysis.
- Cynthia Scullion for valuable and hearty discussions about business modeling notations, as well as for her relentless work in implementing a methodologically sound approach to the development of a common vocabulary for immunization information systems operational best practice guides.
Notes
[a] In this article we use "Euler/Venn diagrams" as a shorthand for "Euler diagrams and Venn diagrams."
[b] Use of circle shapes in Venn diagrams is limited to three circles. In order to show all intersection combinations, with four, five, and more categories under analysis, ellipses and more complex closed shapes must be used. Such diagrams with noncircular shapes become hard to construct, read, and interpret.
[c] Nomenclature of modeling notations in these examples is limited to ConceptSpeak and SBVR.
[d] Subject to privacy laws and regulations.
References
[1] Euler L. (1768). Lettres à une princesse d'Allemagne sur
divers sujets de physique et de philosophie [Letters to a German Princess on
various physical and philosophical subjects] (Saint Petersburg, Russia: l'Academie
Impériale des Sciences, 1768), volume 2, pages 95–126.
URL: https://books.google.com/books?id=gxsAAAAAQAAJ&pg=PA95#v=onepage&q&f=false
[2] Venn J. (1880). On the diagrammatic and mechanical
representation of propositions and reasonings. The London, Edinburgh, and
Dublin Philosophical Magazine and Journal of Science, 10:59, 1–18.
URL: https://www.cis.upenn.edu/~bhusnur4/cit592_fall2014/venn%20diagrams.pdf
[3] A Guide to the Business Analysis Body of Knowledge (BABOK Guide), third edition, International Institute of Business Analysis (IIBA), April 2015.
[4] Business Analysis for Practitioners: A Practice Guide, Project Management Institute, Inc. (PMI), 2015.
[5] Ross R.G. Business Knowledge Blueprints. Enabling Your Data to Speak the Language of the Business, first edition, Business Rule Solutions, LLC, October 2019.
[6] Semantics of Business Vocabulary and Business Rules
(SBVR) standard.
URL: https://www.omg.org/spec/SBVR/About-SBVR/
[7] Modeling of
Immunization Registry Operations Workgroup (MIROW).
URL: https://www.immregistries.org/mirow
[8] Ross R.G. Business Rule Concepts: Getting to the Point
of Knowledge, fourth edition, 2013.
URL: http://www.brsolutions.com/publications/business-rule-concepts/
[9] Unified Modeling Language (UML) standard.
URL: https://www.omg.org/spec/UML/About-UML/
[10] Immunization Information Systems. URL: http://www.cdc.gov/vaccines/programs/iis/about.html
[11] MIROW Common Vocabulary.
A consolidated reference source for terms used in MIROW guides.
URL: https://www.immregistries.org/mirow-common-vocabulary
[12] MIROW Common Vocabulary. Notes Regarding Provider Organization and IIS-Authorized Organization.
URL: https://repository.immregistries.org/files/resources/5cfae4cdd61fb/notes_regarding_iis-ao_vs_provider_org_-_final_7-18-19.pdf
# # #
Standard citation for this article:
About our Contributor:


Online Interactive Training Series
In response to a great many requests, Business Rule Solutions now offers at-a-distance learning options. No travel, no backlogs, no hassles. Same great instructors, but with schedules, content and pricing designed to meet the special needs of busy professionals.