Don't Just Report, Predict!
While it is important to understand and learn from what has already happened, an essential test of effective management is whether future performance can be predicted with any useful certainty. If not, management must be reactive rather than active, indicating a low level of control over the process and its outputs.
It's important and necessary to report on past performance, but wouldn't it be even more useful if we could also predict future performance? Nice to know what happened last month, but what will happen next month? Can we do that? Roger explains how "Yes, we can!"
He discusses what he thinks is the most important process performance management tool ever invented: the Process Behavior Chart (PBC).

To do effective process improvement we must do effective process performance measurement, else how do we know if anything has improved — indeed, how would we know what needs to improve and by how much. That's clear, and surely uncontested.
What does process performance measurement mean? What do we want to know?
Again, we can surely agree that we'd like to know what the process performance should be and what it is; what are the process KPIs (PKPIs) and targets and what is the actual delivered performance. We want to know what the performance should be and what it is.
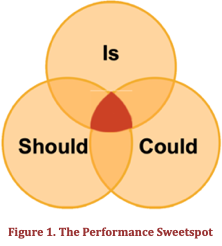 Don't stop there. Let's also ask what the performance could be. What could be possible if we applied new ideas, new approaches, new technology? The stakeholders might be happy now but what could we do to make them delighted?
As shown in Figure 1, we are continuously seeking to operate in the should-is-could sweetspot.
That's useful, but it's not enough.
A key process performance management question must be "What will happen next?"
While it is important to understand and learn from what has already happened, an essential test of effective management is whether future performance can be predicted with any useful certainty. If not, management must be reactive rather than active, indicating a low level of control over the process and its outputs.
It's important and necessary to report on past performance, but wouldn't it be even more useful if we could also predict future performance? Nice to know what happened last month, but what will happen next month? Can we do that? Yes, we can!
In this column I want to discuss what I think is the most important process performance management tool ever invented: the Process Behavior Chart (PBC).
It's the closest you can get to doing magic and still be statistically relevant!
Prediction is difficult, especially about the future[1]
We'll dive into the PBC soon, but first a quick word about variation.
There will always be variation in a performance dataset. We measure variables, not constants. If it's not changing it doesn't need to be measured. The purpose of measurement is to know how much variation there is. Then we can assess if the level of variation is acceptable. Is the variation normal and routine or is there something special or exceptional about a measured change? Has there been a variation that warrants our intervention?
Here is the simple idea that allows us to avoid the data avalanche that inevitably follows if are trying to deal with the details of many PKPIs: a process with predictable performance will vary within known limits unless something happens to change that performance. Such a change might be deliberate, i.e., the result of some process improvement activity, or unexpected. The limits of routine (predictable) variation are an attribute of the data alone and are calculated with a simple formula. Those limits remain valid until some exceptional (non-routine) change occurs, and when it does the data will signal the change.
There is nothing to be gained by looking for the causes of routine variation. There is much to be gained through analysis of the (much less frequent) exceptional variations — find what caused the variation, assess whether the impact is enough to warrant intervention, and if so, remove or amplify the cause as appropriate.
There will always be variation. To manage process performance effectively and efficiently, that variation needs to be predictable and within known and acceptable limits.
A stable process is one where its performance can be predicted, with a high level of confidence, to be within known limits unless something changes. We can be sure that such a process will continue to operate within those limits absent a change.
Of course, performance may be predictable and not acceptable. Being predictable just means that we can be confident that we have a good idea what will happen next. Whether that outcome optimizes performance is a different question.
Signals in the noise
In analyzing process performance data look for the signals that indicate something has changed about the operation of the process. React to the signals, not the noise. Noise reflects routine operation. Signals will appear in the data if something worth investigating has changed (with either a planned or unplanned cause). Simple rules allow for easy identification of such signals in the PBC.
The Process Behavior Chart
The PBC is the filter that captures knowledge enabling the ability to predict process performance which, in turn, empowers effective management.
100 years of development
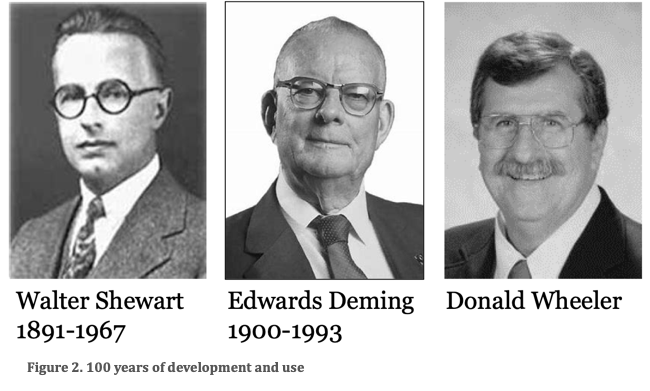
A legacy of the pioneering work of Walter Shewart, Edwards Deming, and Donald Wheeler, and based on 100+ years of development and use, the PBC is a powerful tool.
Previously called an XmR Chart, Wheeler suggested the new name, and other related language changes, in the second edition of his book, Understanding Variation, a book that is a must-read for anyone looking to track process performance.
Another book that provides useful, practical insights into developing and using a PBC for process management is Measures of Success by Mark Graban. Stacey Barr's book, Practical Performance Measurement, also provides useful insights.
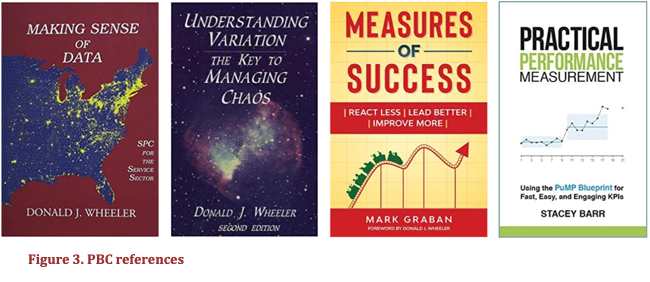
It is my intention in this column to provide a good overview of the development and usage of a PBC. To get the details, select from the books shown in Figure 3. If you are on the statistics-nerd spectrum, you'll find that Making Sense of Data allows you to get under the hood to see why a PBC works. For the rest of us mere mortals, the other books give practical guidance about how to use the PBC.
Anatomy of a PBC
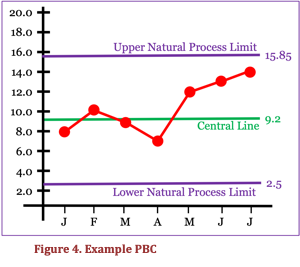 An example PBC is shown in Figure 4.
To be accurate, this is only part of a complete PBC. It is the X part of the XmR Chart. In practice the X Chart is used much more often than the mR Chart.
The PBC has four main elements.
- Measured values of a process KPI are plotted as a time series of data points and are shown here in red.
- The Central Line, shown in green, is the average of a sample of those data points and represents the predictable average performance of the process.
- The Upper and Lower Natural Process Limits (NPL) are calculated numbers based on simple arithmetic involving the averages and a constant. They indicate the range within which 99+% of data points will occur for the process as currently operating.
- A predictable process — i.e., one operating within the limits — is operating at its full potential. Changing performance requires changing the process.
Using a PBC does not require a postgraduate degree in statistics. Rather, it needs the ability to apply the simplest of formulas.
Using a PBC
Making a PBC a practical process management tool is also remarkably easy.
Having established the upper and lower limits and the central line using the baseline data, ongoing performance data is collected and plotted looking for signals.
A signal is a sign of the occurrence of an exceptional variation with an assignable cause that will be worth identifying and analyzing to enable elimination or amplification of the cause to improve the performance of the process.
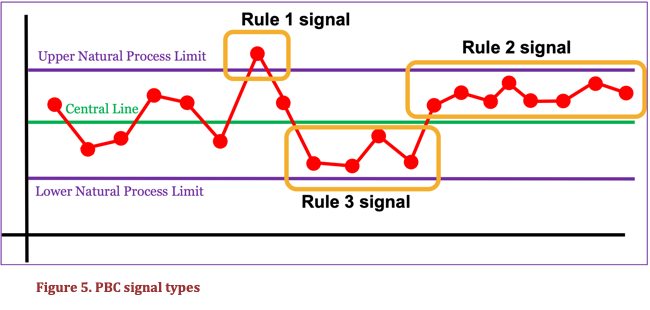
There are three types of signals as shown in Figure 5.
- Rule 1: 1 or more data points outside an upper or lower NPL.
- Rule 2: 8 consecutive points on the same side of the central line.
- Rule 3: 3 out of 4 consecutive points all closer to an NPL than to the central line.
A PBC answers the question "Has a change occurred?" If there has been a change, there will be a signal. If there was a signal, there was a change worth investigating. Importantly, the opposite is also true — we don't chase routine noise in the absence of a signal.
PBC signals don't say what caused the change or what to do about it. The PBC says whether a process has predictable performance, and that performance might be predictably bad.
In reacting to a signal, we are taking immediate short-term action to respond to the root cause of the signal. Investigating noise takes a broader more systemic approach aimed at raising or lowering the central line and, perhaps, narrowing the limits.
The practical cycle of PBC use is that we first set up the PBC using a set of baseline data, then plot the data points until there is a signal. Once we have enough data points (minimum five) beyond the point where the start of the signal was detected, we redraw the chart with a recalculated central line and natural process limits.
Has there been a material change in the performance of the process? If so, was it expected? If not, what was the cause? Is an intervention warranted?
And repeat, searching for any signal that a change of consequence, or lack of an expected change, has happened or might be about to happen.
Search. Signal. Analyze. Redraw. Respond. Repeat.
Building a PBC
A short note and example about the basics of building a PBC. Figure 6 refers.
- Set up the axes as required and plot the time series data points (X).
- The central line plot is the average (AvgX) of the baseline data points. A minimum of 5 points is needed and sufficient. More can be used, and the accuracy will increase, but incremental benefit is negligible after 25 points.
- The Moving Range (MR) for the data set is the absolute value of the difference between consecutive values. Calculate the average MR (AvgMR).
- Natural Process Limits are calculated as follows:
- Upper NPL = AvgX + 2.66*AvgMR = 9.2 +2.66*2.5 = 15.85
- Lower NPL = AvgX – 2.66*AvgMR = 9.2 – 2.66*2.5 = 2.55
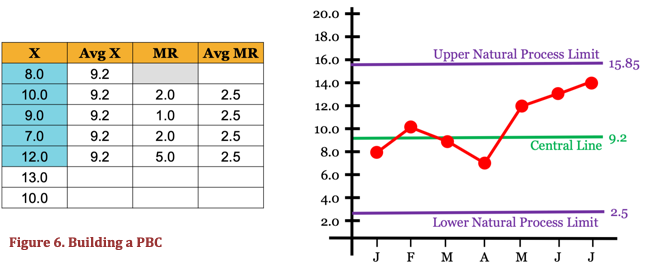
The PBC in Figure 6 tells us that, if the process is not changed, the value of this KPI will very likely vary around an average of 9.2 and we can expect values from 2.5 to 15.85. The process is predictable with a high level of confidence within that range. If that level of performance is acceptable, and in the absence of any signal, we can ignore variations within the 2.5 to 15.85 range because they are caused by routine noise and will not have an assignable cause.
Read that paragraph again. That's a very big deal. We just radically reduced the process performance tracking workload.
Further notes about the PBC
In using the PBC we need to remember:
- Natural process limits are calculated, not chosen. They are not targets and the PBC doesn't care if you like them or not!
- A PBC tells when a performance intervention is warranted, but not when there is a new idea to be tested.
- PBC signals may be expected or unintended. Therefore, we find a signal and explore the cause, or make a change and look for a signal of success.
- A PBC does not require a particular data distribution; they work for any data distribution, e.g., Normal, Binomial, Poisson etc.
- PBCs work for both count (discrete) and continuous (rate) data types. Other chart types (np, p, c, u) are not needed.
(Send your arguments to Dr Wheeler! 😉 )
Signals in the noise
Donald Wheeler neatly sums up the theory and practice of process behavior charts for us: PBCs are a way of thinking with tools attached.
We can, and should, listen when he also says:
"Process behavior charts work. They work when nothing else will work. They have been thoroughly proven. They are not on trial. The question is not whether they will work in your area. The only question is whether or not you will, by using these tools and practising the way of thinking which goes with them, begin to get the most out of your processes and systems." [Understanding Variation].
Using a PBC allows us to focus on what is important and avoid chasing shadows. It is a vital aid in making the process of process management and improvement our most efficient and effective process.
Predicting process performance
Can we usefully predict process performance? Yes, we can.
For a stable process, we can say what is very likely to happen next week, not just what happened last week. When we make a change to a process, we can predict the signal that will confirm the effect of our change. If a change happens for any other reason, we can detect the signal and explore the cause.
When we are doing all of this, we are displaying real process management mastery.
Notes
[1] Variations on this statement abound. A common attribution is to Niels Bohr.
# # #
Standard citation for this article:
About our Contributor:

")


Online Interactive Training Series
In response to a great many requests, Business Rule Solutions now offers at-a-distance learning options. No travel, no backlogs, no hassles. Same great instructors, but with schedules, content and pricing designed to meet the special needs of busy professionals.
How to Define Business Terms in Plain English: A Primer
How to Use DecisionSpeak™ and Question Charts (Q-Charts™)
Decision Tables - A Primer: How to Use TableSpeak™
Tabulation of Lists in RuleSpeak®: A Primer - Using "The Following" Clause
Business Agility Manifesto
Business Rules Manifesto
Business Motivation Model
Decision Vocabulary
[Download]
[Download]
Semantics of Business Vocabulary and Business Rules