Measuring Performance (Part 1)

Introduction
This is the eighth column in my Business Architecture Essentials series. Having covered several topics relating to business architecture in previous columns, it is time to deal with the question of how we can measure what we have defined. How can we tell if our Business Model is working? How do we know if our Operating Model choices were good ones? Are our resources being well used? Do we have the culture we strive for? How can I know what's working and what's not? Which of the landscape domains (Figure 1) are measurable? Which are worth measuring?
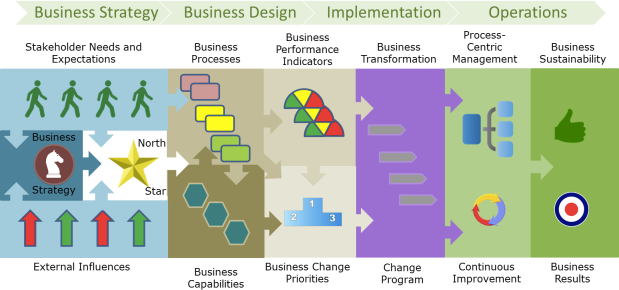
Figure 1.
Defining a connected measurement framework makes sense now that we have things
 to measure and we can connect them in a traceable way. We now know the external opportunities and threats, the needs and expectations of the business external stakeholders, the ends and means of the strategy of the business value chains, and the aspirations we are striving for in the North Star target. We also know which value-creating business processes we have to manage and which capabilities need to be in place to do so. In our strategy and process design work, we should also have articulated what behaviours and cultural attributes we deem desirable or critical to attain our harder goals. So, what kind of measurement information do we need to make the decisions that must be made in the
remaining work of architecture development, in change resource allocation, and in day-to-day business operations? What do we need to know in order to manage?
to measure and we can connect them in a traceable way. We now know the external opportunities and threats, the needs and expectations of the business external stakeholders, the ends and means of the strategy of the business value chains, and the aspirations we are striving for in the North Star target. We also know which value-creating business processes we have to manage and which capabilities need to be in place to do so. In our strategy and process design work, we should also have articulated what behaviours and cultural attributes we deem desirable or critical to attain our harder goals. So, what kind of measurement information do we need to make the decisions that must be made in the
remaining work of architecture development, in change resource allocation, and in day-to-day business operations? What do we need to know in order to manage?
The Value of Measurement
Anyone who has the experience of trying to define measures to live by will confirm that this is one of the hardest things to get right, although it looks deceptively
 straightforward at the outset. Is it worth the aggravation? I think it is — so, let's see what measurement is used for. There are many things that can be measured, but measurement should first and foremost help decision making about acting on adjustments and change. Most organizations do not have a shortage of existing measures but do not have sufficient knowledge and ability to measure the right things, and they have insufficient data to back up many of the decisions they need to make. Some of the benefits of having the right performance indicators and trustworthy performance data are to be able to better understand what is really happening in the business so that we can do the following:
- Plan Business Strategies and Tactics
- Inform goal setting
- Design transformation programs based on current data feedback
- Make prioritization and resource investment decisions
- Budget resources better
-
Connect Operations to Strategy
- Develop traceability of scorecards from top to bottom
- Develop leading and lagging indicators
- Assign responsibilities for performance to organizational units
- Monitor organizational alignment to value chain outcomes
-
Evaluate strategy execution progress and adapt
- Control work and resources
- Learn what works and does not and why
- Change tactics and strategy based on reality
- Monitor alignment of work assignment
-
Assess the human aspects of work
- Align incentives of people with desired performance results
- Determine the behavioral fit and gaps of individuals and groups with the envisioned culture
- Motivate managers and staff
- Evaluate the human acceptance and readiness for change
-
Make quick adjustments in operational execution
- Monitor business operations and evaluate what's working and what's not
- Reallocate resources operationally very quickly for control or improvement
- Align individual performance incentives with formal organization targets
- Change behavior and build culture
The Quality of Measurement
Measurement enables the business nervous system to function and keeps all work on track so long as the measurement data is accurate, timely, and trustworthy — and is used. This requires us to have high-quality performance indicators. Following the concept of 'SMART' objectives, good measures have the following characteristics.
- Relevant:
- Supports the assessment of a vision or goal or something that one must know in order to track and make a management decision.
-
Comparable:
- Has a distinct Unit of Measure that can be compared over time periods and or locations or other companies (benchmarking).
-
Time bound:
- Is associated with a period of time or a point in time.
-
Measurable:
- Reliable data can be attained without bias or excessive time and cost.
-
Reliable
- The more factual the better although external perceptions may also serve as facts.
-
Trustworthy:
- People feel confident that it is accurate even if they do not like it.
Often times we hear business managers and analysts talk in terms of some very vague or non-specific measures such as:
- We want to improve our reliability.
- We aim to increase customer satisfaction.
- We need to get better staff loyalty.
None of these has a performance indicator in it. These are goals to be attained but are not measurable without some interpretation and determination of how we will know that we are getting there. We need a unit of measure for which we can gather data. What could we use to achieve these goals?
- We want to improve our reliability as measured by the percentage of orders that are perfectly executed (right product delivered to the right place, at the agreed time, for the agreed price, paid on time).
- We aim to increase customer satisfaction as measured by net promoter score.
- We need to get better staff loyalty as measured by annual turnover percentage of employees.
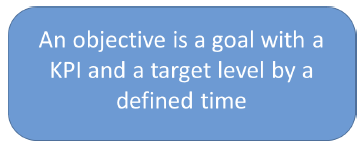
According to the Business Motivation Model from OMG, these goals are getting closer to becoming objectives, and we will have accomplished that by adding a target and a timeframe.
- We want to improve our reliability as measured by the percentage of orders that are perfectly executed (right product delivered to the right place, at the agreed time, for the agreed price, paid on time) to 95% within one year.
- We aim to increase customer satisfaction as measured by increasing net promoter score by 10 points in eighteen months.
- We need to get improved staff loyalty as measured by decreasing annual turnover percentage of employees to 8% by the end of the calendar year.
By structuring measures well, we now have a set of indicators that can be evaluated periodically to monitor progress against our business and personal targets.
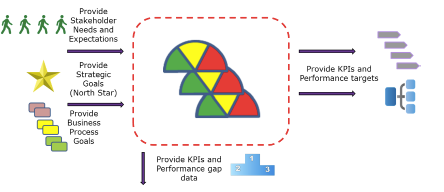
Please note that a Key Performance Indicator (KPI) does not exist in its own right. It is always associated with something else as an attribute. So, the structure of the measurement system typically will follow some other structure we may have already figured out, such as our process hierarchy (which we feel is a good choice).
The Structure of Measurement
Counts (things)
The starting point for all measurement is to count things — an inventory, if you like. Clearly there are lots of things we could count, but typically we choose the ones of importance to us because of risk, strategy, or some form of operational importance. Stakeholders are important, so we count them. How many customers of various types do we have? How many employees of various classifications do we have?
Physical items are the next most obvious. How many branch offices are there? How many mobile phones are there? How many locations provide services? There are also many non-physical items that need to be tracked such as orders, transactions, and agreements. Do we know what the counts are?
In addition, can we determine other important attributes about each such as the size of the branch office, the longevity of tenure of staff, how old is each brand and model of mobile device that we have.
One tool that can help us with this is the Concept Model (Figure 2) that we used to determine information, capabilities, and processes as described in previous columns.
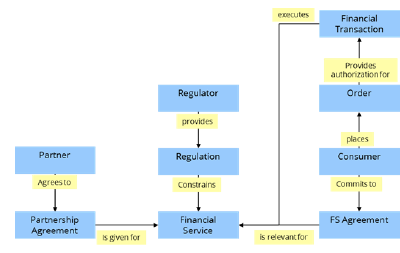
Figure 2.
If we look at every box (noun=thing) there is the potential of having a count for all of them if we feel it will be useful to someone to be able make a management decision about it. Please note that I am not assuming that these decisions are managers' decisions but are decisions required to be able to manage, regardless of who makes them. Organizational structure is irrelevant to what you need to know at this point.
Associations (things per thing)
Many things are relevant more in their association with other things and with some organizing factor or set of factors. Typical factors would be counts of some things of interest relative to items such as organization unit, role, or person. They can also be tied to some work mechanism such as a system, a process, or location. Some examples would be:
- Number of orders received and the total dollar amount by location for each order type
- Number and size distribution of financial service transactions for each channel of customer interaction type (web, kiosk, branch…)
Possible measurement associations can often be seen directly from the concept model by looking for the direct linkage of concepts (nouns) by the wordings between them (verbs). Some examples would be:
- Number of orders received by and the total dollar amount for each consumer category (from the consumer to order linkage)
- Number and size distribution of financial service transactions for each financial service type (from the financial transaction to financial service linkage)
Looking at every direct link between concepts in the concept model will allow us to question whether or not there is some associative measure of importance to the decision making or execution of the business.
Going beyond counts (timing of things)
I often see organizations initially defining measures in non-comparable ways. When it comes to nailing down useful KPIs, the timing factor has to come into play to see trend lines. The examples above are examples that are still not yet fully formed since we have not defined the period over which we will compare and contrast them. Are we counting daily or annually? The numbers will be hugely different — and the reporting period and systems requirements for gathering and consolidating, quite different also.
By adding in the time factor, we now are able to compare apples to apples meaningfully in all places that we sell apples. Reframing the previous examples would give us useful measurement data to work with:
- Number of orders received by consumer category by and the total dollar amount for the category per month.
- Number and size distribution of financial service transactions for each financial service type per quarter.
Going beyond counts: ratios
Most of the associative performance indicators are based on counts factored by the counts of other associated things. For example 'number of orders per customer category per month'. It is typical to see performance indicators report exceptions to the norm or to the desired outcome as a ratio. Many meaningful indicators are best expressed as a comparison of one count by volume of another such as:
- the percentage of all financial transactions delivered by partners per month
- the ratio of returned orders over total orders by sales channel per month
Again, the usefulness of the performance indicator is gauged by how well it informs those who need to know in order to act and change something about how work is performed.
Going beyond counts: who cares?
So far, I have delved into the easy part of measurement; counting and comparing the things and associations that are discrete and for which data is more readily available as a bi-product of doing the work (as long as we have the capture mechanism or can derive it from our work mechanisms such as IT systems). Now we come to the hard part, which is where the soft part comes in.
With the unrelenting push toward customer focus comes the question, "How do we know how they feel about us?" Customer journey mapping, customer satisfaction surveys, and the drive to customer experience improvement are all aspects of this phenomenon. In an earlier column, I discussed the issue of stakeholder expectations of value and the fact that great experience in terms of how things were being done was not so useful if the main value delivered through the product or service was not up to par. For example, the staff were nice but sold us the wrong product. We have to evaluate both factors in light of customer expectation.
The challenge is that the expectation may be easily met if you do not expect much in the first place. A great example of this is seen in hotel ratings listed online by various travel sites. The super high-end hotels often do not get the best ratings because the expectation of hotel visitors approached perfection because of the high price paid. In the same survey ranking list, you will often see much lower-priced hotels with great ratings because no one expected the features and services of a five-star property in a two-star hotel that was one quarter of the price.
Comparables here are much harder to rationalize. Nonetheless, we can still evaluate the satisfaction level and the experience perception of the external stakeholder. If this can be captured through counts and associations, that may be the best we can do. Sometimes proxy measures are an easier way to judge this factor. For example, can we trust that the easily-measurable indicator of repeat business is a good indicator of satisfaction, or should we ask or do both?
Future Columns
Next time I will wrap up my discussion of Measuring Performance.
That's the way I see it.
# # #
Standard citation for this article:
About our Contributor:

")


Online Interactive Training Series
In response to a great many requests, Business Rule Solutions now offers at-a-distance learning options. No travel, no backlogs, no hassles. Same great instructors, but with schedules, content and pricing designed to meet the special needs of busy professionals.
How to Define Business Terms in Plain English: A Primer
How to Use DecisionSpeak™ and Question Charts (Q-Charts™)
Decision Tables - A Primer: How to Use TableSpeak™
Tabulation of Lists in RuleSpeak®: A Primer - Using "The Following" Clause
Business Agility Manifesto
Business Rules Manifesto
Business Motivation Model
Decision Vocabulary
[Download]
[Download]
Semantics of Business Vocabulary and Business Rules