Measuring Performance (Part 2)

The Structure of Measurement
Counts (things)
The starting point for all measurement is to count things — an inventory, if you like. Clearly there are lots of things we could count, but typically we choose the ones of importance to us because of risk, strategy, or some form of operational importance. Stakeholders are important so we count them. How many customers of various types do we have? How many Employees of various classifications do we have?
Physical items are the next most obvious. How many branch offices are there? How many mobile phones are there? How many locations provide services? There are also many non-physical items that need to be tracked such as orders, transactions and agreements. Do we know what the counts are?
In addition, can we determine other important attributes about each, such as the size of the branch office, the longevity of tenure of staff, how old is each brand and model of mobile devices we have. One tool that can help us with this is the Concept Model (Figure 1) that we used to determine information, capabilities, and processes, as described in prior Columns.
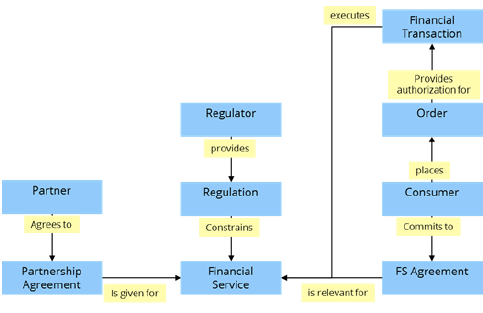
Figure 1.
If we look at every box (noun = thing) there is the potential of having a count for all of them if we feel it will be useful to someone in making a management decision about it. Please note that I am not assuming that these decisions are managers' decisions but are decisions required to be able manage, regardless of who makes them. Organizational structure is irrelevant to what you need to know at this point.
Associations (things per thing)
Many things are relevant more in their association with the other things and with some organizing factor or set of factors. Typical factors would be counts of some things of interest relative to items such as organization unit, role, or person. They can also be tied to some work mechanism such as a system, a process, or location. Some examples would be:
- Number of orders received and the total dollar amount by location for each order type.
- Number and size distribution of financial service transactions for each channel of customer interaction type (web, kiosk, branch…).
Possible measurement associations can often be seen directly from the concept model by looking for the direct linkage of concepts (nouns) by the wordings between them (verbs). Some examples would be:
- Number of orders received by and the total dollar amount for each consumer category (from the consumer to order linkage).
- Number and size distribution of financial service transactions for each financial service type (from the financial transaction to financial service linkage).
Looking at every direct link between concepts in the concept model will allow us to question whether or not there is some associative measure of importance to the decision making or execution of the business.
Going beyond Counts (timing of things)
I often see organizations initially defining measures in non-comparable ways. When it comes to nailing down useful KPIs, the timing factor has to be considered in order to see trend lines. The examples just above are examples that are still not yet fully formed since we have not defined the period over which we will compare and contrast them. Are we counting daily or annually? The numbers will be hugely different and the reporting period and systems requirements for gathering and consolidating quite different also.
By adding in the time factor we are now able to compare apples to apples meaningfully in all places that we sell apples. Reframing the previous examples would give us useful measurement data to work with:
- Number of orders received by consumer category and by the total dollar amount for the category per month.
- Number and size distribution of financial service transactions for each financial service type per quarter.
Going beyond Counts (ratios)
Most of the associative performance indicators are based on counts factored by the counts of other associated things. For example, 'number of orders per customer category per month'. It is typical to see performance indicators report exceptions to the norm or to the desired outcome as a ratio. Many meaningful indicators are best expressed as a comparison of one count by volume of another such as:
- The percentage of all financial transactions delivered by partners per month.
- The ratio of returned orders over total orders by sales channel per month.
Again, the usefulness of the performance indicator is gauged by how well it informs those who need to know in order to act and change something about how work is performed.
Going beyond Counts (who cares?)
So far I have delved into the easy part of measurement: counting and comparing the things and associations that are discrete and for which data is more readily available as a bi-product of doing the work, so long as we have the capture mechanism or can derive it from our work mechanisms like IT systems. Now the hard part, which is where the soft part comes in. With the unrelenting push toward customer focus comes the question, "How do we know how they feel about us?" Customer journey mapping, customer satisfaction surveys, and the drive to customer experience improvement are all aspects of this phenomenon. In an earlier Column, I discussed the issue of stakeholder expectations of value and the fact that great experience in terms of how things were being done was not so useful if the main value delivered through the product or service was not up to par. For example, the staff were nice but sold us the wrong product. We have to evaluate both factors in light of the customer expectation.
The challenge is that the expectation may be easily met if you do not expect much in the first place. A great example of this is seen in hotel ratings listed online by various travel sites. The super high-end hotels often do not get the best ratings because the expectation of visitors to the hotel anticipated perfection because of the high cost per room. In the same survey ranking list you will often see much lower priced hotels with great ratings because no one expected the features and services of a five star property in a two star hotel that was one quarter of the price. Comparables here are much harder to rationalize. Nonetheless, we can still evaluate the satisfaction level and the experience perception of the external stakeholder. If this can be captured through counts and associations, that may be the best we can do. Sometimes proxy measures are an easier way to judge this factor. For example, can we trust that easily measurable indicators of repeat business is a good indicator of satisfaction, or should we ask or do both?
The Structure of Scorecards
Original Balanced Scorecard
In the early 90s Kaplan and Norton published a number of articles and books advocating a multi-variant approach to measuring business performance aimed at getting away from solely after-the-fact financial indicators, with the rationale that once the financials were in it was too late to do anything about them. They advocated for a number of indicator categories to be reported and evaluated periodically that were not after the fact. To get a better insight into what was happening along the way, they advocated leading indicators in different categories. Their view was to utilize a Balanced Scorecard with the four quadrants as shown in Figure 2.
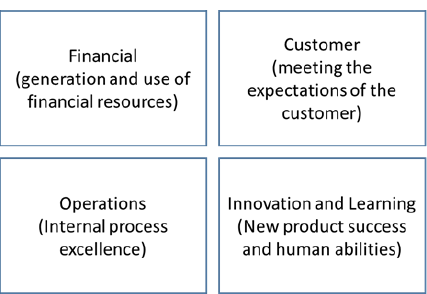
Figure 2.
This is now considered to be a traditional balanced scorecard. This approach kept the financial view but added others:
- The Customer view reflected what is important to the markets we are serving and shows how well we are doing with them in terms of well-established indicators such as market share.
- The Operations (often called the process view) perspective looked at internal efficiencies and quality such as average time spent by call center staff with a caller online.
- The Innovation and Learning POV focused on key indicators such as time-to-market and emphasized the sharing of knowledge.
These additional types of measures were very useful for executives in tracking the overall progress of the company and — along with Kaplan and Norton's companion innovation, the strategy map — gave organizations a way to develop plans that tackled multiple perspectives and a way to strategize how to achieve the targets in each, going forward.
The challenge occurred when attempting to build a scorecard that would cascade well down the organization chart. As the four quadrants were pushed downwards in order to find a traceable system of measurement, it was realized that several of these sectors were ill suited, since the decomposition just broke things up that were not decomposable in organization chart terms. The result of force fitting lower level work into the same set of Balanced Scorecard categories meant that concepts of value creation were compromised by focusing upward internally not to the ultimate outside. End-to-end processes were broken into organizational unit sub-processes that were only a part of the whole. In the drive to optimize the whole set of group's work, overall value was lost and sub optimization ran rampant. In addition, innovation and learning issues became focused locally and not to the whole business. Also, sharing insights was hard to accomplish outside of a group. For these structural reasons, the balanced scorecard has fallen out of favor in the last few years as organizations become more concerned with end-to-end value creation.
Value-oriented Balanced Scorecard
Seeing the value of multiple measurement perspectives, we at PRG felt that a value-oriented and cross-functional scorecard was in order. We thought that measures that were directly traceable to customer outcomes and other stakeholder needs and expectations of value was needed. Consequently, we looked at the prevalent value-oriented approaches that focused on the value we would want to create for the myriad of external stakeholders of the organization, and we worked backward from there. There are four main categories that we have found to be most useful, as shown in Figure 3.
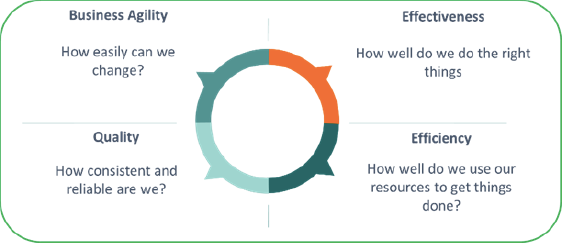
Figure 3.
Effectiveness
Effectiveness considers if we are doing the right things for external customers and consumers in the first place, and if so, how well do we do it in their eyes. This sector contains the customer value-creation point of view as well as the business' view of success with them. Typical indicators would be tied to the following:
- Customer satisfaction rating
- Net Promoter Score
- Customer effort score
- Market share
- Wallet share
- Cost of non-compliance to customer expectations
- Repeat business revenue
- Lifetime value
Efficiency
Efficiency considers how well your business utilizes its consumable and reusable resources to deliver the outputs. These measures are the classic production types that have been the subject of process improvement regimes such as Lean and Six Sigma over the years. They are typically agnostic to the question of 'are we doing the right things?' and are more focussed on 'are we doing things right?' Some indicators may be:
- Cost of service per transaction
- % transactions that are straight through
- Ratios of outputs to time and cost incurred
- Proportion of Waste
- Average time to resolve a problem
- Service Level Agreement compliance
Quality
Quality deals with how well we meet the expectation of the product or service recipient in terms of consistency and how well we meet standards. It also covers the implications of a lack of quality. Some examples are:
- Defects / returns ratios to total counts
- Consistency of outputs
- Cost of non-compliance of extra work to correct lack of quality or risk compliance (rework)
- Reliability of products delivered (performs as defined or specified)
- Complaints ratios
- Cost of lost future business due to poor quality
- Compliance costs (fines and restrictions)
Business Agility
Business Agility covers the ability to change quickly and be effective when doing so. It includes operational agility, which considers the ease of adapting day-to-day to market conditions. It also covers reconfiguration agility that allows insights to be turned into designs quickly, and designs into operations rapidly. Quick change includes all aspects of change, not just technology. Some illustrations are:
- Time to market for a product or service
- Number of insights generated annually and the conversion rate into executable offerings
- Proportion of customer special requests or variations turned down
- Cost of change
- Flexibility of software for varying usage
- Ease of assignment reallocation (resources downtime on a change)
- Staff knowledge (or access to it) of the business
- Availability of current environment and asset knowledge
The Scorecard Structure
For the most part, the structure of the indicators will follow a value creation structure, meaning value streams and business processes are quite often what's being measured, or at least the place to hang measures in the reporting hierarchy. At the top levels, the indicators are very much associated with the stakeholders of the end-to-end process or value chain. These measures will be strong contributors to the overall satisfaction of the stakeholders. As we dive deeper, we will discover the component processes or value stream stages, some of which will deliver direct stakeholder value, but some will be more internal and not apparent to the stakeholder (but nonetheless necessary). In those cases, we will still have value measures but we will be acting on behalf of the recipient, as well as taking other stakeholders' requirements into account. For example, running a credit check before accepting a loan request is still of value to the business even if not appreciated by the requestor. This hierarchy typically follows the process architecture structure as shown in Figure 4.
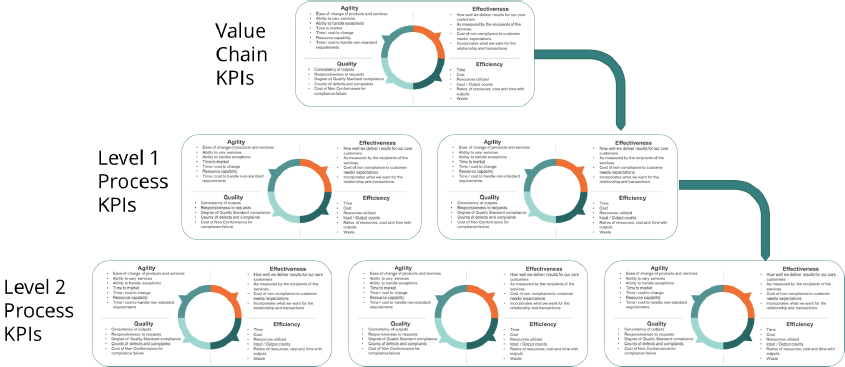
Figure 4.
Throughout the series of columns, it is clear to see that we can measure a lot of things, some directly and some indirectly. We need to have indicators of:
- Strategic Objectives
- Stakeholders' relationships
- The North Star directional guidance assessment
- The work we do (business processes / value streams)
- Counts of all concepts and specializations of them
A number of other architectural elements are also important and cannot be measured directly since they have no inherent value until put into action. These include information and capabilities. While we obviously need good accessible information and certain strong capabilities, if they are never actioned their value cannot be seen. Their value is the difference that each makes once enhanced to the KPIs of the business in action (i.e., the processes). A big performance gap implies a big capability gap. Fixing the capabilities will close the gap. This phenomenon is more obvious once we consider that information is used all over the organization and good capabilities may be served up in many value streams, making this even harder to appreciate and capture explicitly.
We also have to connect indicators into a cause/effect pattern. With the strategy structure connected to the process structure we can accomplish this and define our dashboard requirements. Of course for the dashboard to function, we not only have to provide the structure we also have to provide ranges of performance data levels that signify danger, concern, and safety. These levels are often shown as red, yellow, green lights on the management dashboard. With the KPI structure and the defined rules on limits of performance we should also be able to drill down the stack to the causes of concern over actual performance problems.
A Scorecard Planning Template
For all of the levels of the scorecard hierarchy there are a number of attributes which we could describe. A template for each level of work activity is shown next in Figure 5 to illustrate the types of measures, the desired direction of the measurement data, the method of data collection, the current level, and the desired level of performance of the indicator.
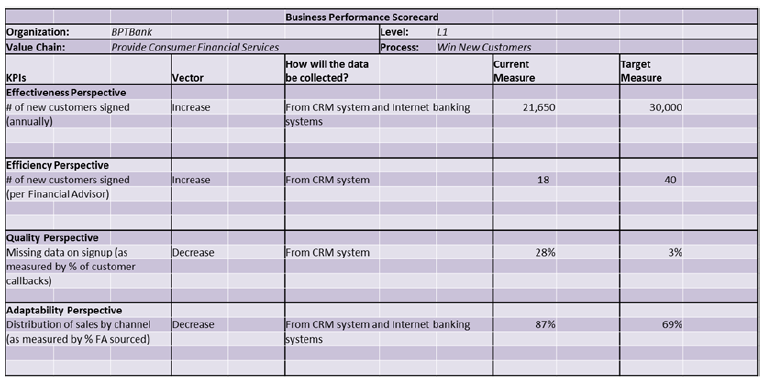
Figure 5.
Reconciling the Measurement Indicators with your Current Measures
We all know that a clean sheet is unrealistic when it comes to measurement. There are invariably lots of measurements being reported today but are they useful? A good idea is to reconcile these with your process architecture and some work levels more deeply to see if all your current measures have a home, and to see if any can be replaced for better options based on the balanced point of view.
By cross correlating the list of KPIs to the process hierarchy, several questions can be asked:
- Are there too many KPIs for this bucket of work?
- Are there too few KPIs for it?
- Are existing KPIs sufficient or do we need some new ones as well?
- Can we drop any current ones in favor of some new ones?
- Do we have KPIs which have no process associated?
- Does a KPI cover too many processes or should each have more specific indicators?
This is a good sanity check that should be done with the management team to gain commitment on a better way of measuring and of managing.
Measurement Opportunities, Challenges, and the Problem of Bias
Gathering the Data: How much is enough?
As we have seen, measurement can be overwhelming if taken too far. Our challenge is to capture just as much as we need to make good operational decisions as well as management decisions. It is easy to get caught up in trying to get absolute precision in all our measurement data. If you are fortunate to have measurement data-capture built into all your IT systems, or smart enough to have designed them to capture everything as you go, then congratulations, you are on your way. The challenge is that for all the things you want to know that are not systematizeable you will have to design data capture into your processes and go out and capture that information. At worst you will have to sample the population of transactions.
The question then becomes one of need for statistical significance of the measures, and you will have to decide what a sound sample looks like according to the rules of sampling theory, so you can remain unbiased and assured. You also have to decide what degree of precision you need since if you are not careful you will expend more energy gathering the data than the effort required to do the work itself. There is a fine line between enough and not worth it. Furthermore, some data may be wonderful to have but the methods required to get it may be convoluted and the results unreliable. Perhaps some simple proxy may be better and still give sufficient insight as to what's going on. Attention to how the data can be acquired is an important consideration.
Alignment with Personal Motivation
There will always be arguments over what data to collect, since managers know that if we are going to capture it, then someone (herself?) will become accountable for it — something they will shy away from. Performance indicator data and the associated targets are almost always tied to the formal or informal incentives of an organization and the people within it. Peter Drucker is attributed as having said that without measurement it is hard to hold onto staff's attention. He also said the without feedback, it is like having staff hit golf balls into the fog. So long as the individual's indicators are in alignment with everyone else's indicators and are traceable to overall strategic objectives, then personal incentive will push behavior and decision-making in the intended direction. Sadly, most of the time, this traceability and alignment is lacking and indicators are not well connected.
However, if done poorly, laser focus on the personal and organizational objectives can actually lead to significant sub optimization and conflict in terms of end-to-end results for the stakeholders and non-realization of strategic intent. Everyone drives toward targets but often these are the wrong targets since they are biased towards divisional motivations. It is imperative that, when deriving the hierarchy of measures, it not be done based on the organization chart, but on the process architecture and the results of value streams, agnostic to the formal organogram. With the right set of performance indicators aligned to value delivery rather than an arbitrary formal hierarchy that breaks up value propositions, we can ask who can take accountability for monitoring and advocacy for whatever needs to be done to attain intended results. Then and only then can we see how the organization maps to the performance hierarchy.
There is also a challenge with perception-based measures since it has become easier to ask the customers for their opinion than ever before. So, what is a good measurement strategy? With so much online booking of services and digital delivery it is simple for the service provider to be able to automatically generate surveys for perception-based feedback and scoring. Since I travel a lot, I expect to see survey requests coming at me for everything I do. On a recent trip, I had survey e-mails from my airline for each of two flights, from the hotel I stayed in for the few nights I was there, and from my restaurant booking company for the three restaurants I visited. I responded to exactly none of them. My concern is that we have reached the stage of survey overload (at least for me) and that we are back into the realm of the customer comment card in hotel rooms in the past. The only time I filled them out was when I was over the moon with the great service (someone going out of their way to solve a key requirement of mine) or if something happened that was so poorly dealt with I just had to tell them. Anything in between got no action from me. I have reached the same point with online surveys now. I typically just delete them, and I think I am not alone. I have to wonder how representative the samples of reality are. Are too many surveys of customer experience detracting from their actual experience?
The Observer Effect
In science, the term observer effect means that the act of observing will influence the phenomenon being observed. In business it means that the act of measuring will bias the measurement data. We all know from high school days that the insertion of a thermometer into a substance will not accurately capture the temperature of the material. Physics geeks are quick to talk about the Heisenberg Uncertainty Principle that shows that you cannot determine both the speed and location of an atomic particle, since if you get one, the other is not knowable. The classic business example goes back to the observations that led to the discovery of the Hawthorne effect in which it was shown that when people are watched, they change their behavior. Experiments at the Hawthorne Works in the 1920s adjusted working conditions in multiple ways to observe worker productivity. No matter what they did, the performance improved but only for short periods and the conclusion was that the fact that workers were getting the attention from and wanted to please the experimenters was the driving reason, not the innovations. As a former Industrial Engineer forced to do time studies in full view of the subjects, I can assure you that the workers did not work the same way when I was not there watching.
Visibility of measurement data alone can be a blessing if done appropriately. On a recent process improvement exercise we noticed a significant amount of disagreement regarding the straight through processes (STP) rate for loan applications. We got numbers from 40% to 70% from different groups. And executives. Once we sampled 100% of the universe of transactions from the preceding year we found it was about 55%. The measurement indicator was then added to the scorecard for all locations and for all staff to see, and within two months the results jumped closer to 70% with zero process or technology changes. Being aware of the data can be a powerful, virtuous motivator affecting behavior in its own right when aligned.
Discovering bias-free ways of getting the data and aligning with motivation is as important as the data being sought.
Measurement and Behavior
One of the benefits of measurement is that it enables aligning process work to results, analysis of those results, and the discovery of the causes of poor process and individual performance. This allows us to help people to improve performance. A problem, however, occurs when the organization wants a culture that is different from today and the hard measures are not sufficient to capture the behaviors of the individuals which collectively reflects that culture. The jury is still out on appropriate measures to indicate behavioral consistency with what's needed. There is no simple scorecard to show this. It is still our view that defining the behaviors desired under a set of circumstances is a key part of defining requirements. Designing the observation and coaching roles required (Figure 6) as part of process design and development is a critical aspect that is often missed. It is an essential complement to measurement.
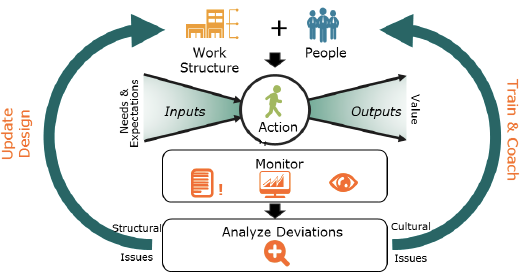
Figure 6.
Measurement and Organizational Maturity
Making a serious commitment to aligned and traceable measurement is a big ask. It does not mean that your organization has no measurements today and should get some. You all probably have lots already, but a real commitment to base measurement as a more formal discipline based on the business architecture and the operating model of the organization implies that responsibilities for measurement outcomes be established and honored. Typically, that requires certain aspects of the architecture be in place. It is hard to assure traceability if no clear strategic framework exists and if no business process architecture is available. If they are not in play, do your best to get some measurement thinking and some common sense indicators in place while you build out the operating model. If you have these models, then determine your performance structure, your indicators, and your targets and strive to make measurement a key part of managing. Everything will reconfigure itself because there will be a 'why' to aim for.
Future Columns
Measurement ability builds on the business model and the operating model. Gaining alignment for all and assuring a traceable measurement dashboard and data capture mechanisms will be worth it. These will help us to become better focused on customers and end-to-end management. With clear strategic requirements framed earlier in our journey, good architectural models for processes and capabilities and measurable performance, we will be able to prioritize the changes of the greatest strategic importance as well as performance improvement potential along with the capabilities that should be addressed to derive a transformation roadmap. That will be the topic of the next column in this series.
That's the way I see it.
# # #
Standard citation for this article:
About our Contributor:


Online Interactive Training Series
In response to a great many requests, Business Rule Solutions now offers at-a-distance learning options. No travel, no backlogs, no hassles. Same great instructors, but with schedules, content and pricing designed to meet the special needs of busy professionals.
How to Define Business Terms in Plain English: A Primer
How to Use DecisionSpeak™ and Question Charts (Q-Charts™)
Decision Tables - A Primer: How to Use TableSpeak™
Tabulation of Lists in RuleSpeak®: A Primer - Using "The Following" Clause
Business Agility Manifesto
Business Rules Manifesto
Business Motivation Model
Decision Vocabulary
[Download]
[Download]
Semantics of Business Vocabulary and Business Rules